Inbound Demo Conversion Rate: The Complete Guide, Stage by Stage
The six stages of an inbound demo funnel, what the published data says about each one, the maths that turns stage rates into new ACV, and what to fix first.
Aura Team13 min read
The short answer
Inbound demo conversion rate is the share of demo requests that become closed-won deals, measured stage by stage: request, qualified, booked, held, opportunity, won. Published data puts qualified-to-booked at 62 to 67% with instant booking and booked-to-held at 84 to 87%. Median win rates fall from 31% under $10K ACV to 15% above $100K. Fix booking and held rate first, because they're the cheapest stages to move.
That's the short version. Here's the full picture: what each stage means, what the published data says about each one, the maths that turns a stage rate into new ACV, and the order to fix things in. It's written for heads of sales, founders and RevOps leads at software companies that sell through demos.
One rule runs through the whole guide. A single end-to-end conversion rate tells you almost nothing. Six stages tell you where the gap is.
What inbound demo conversion rate measures
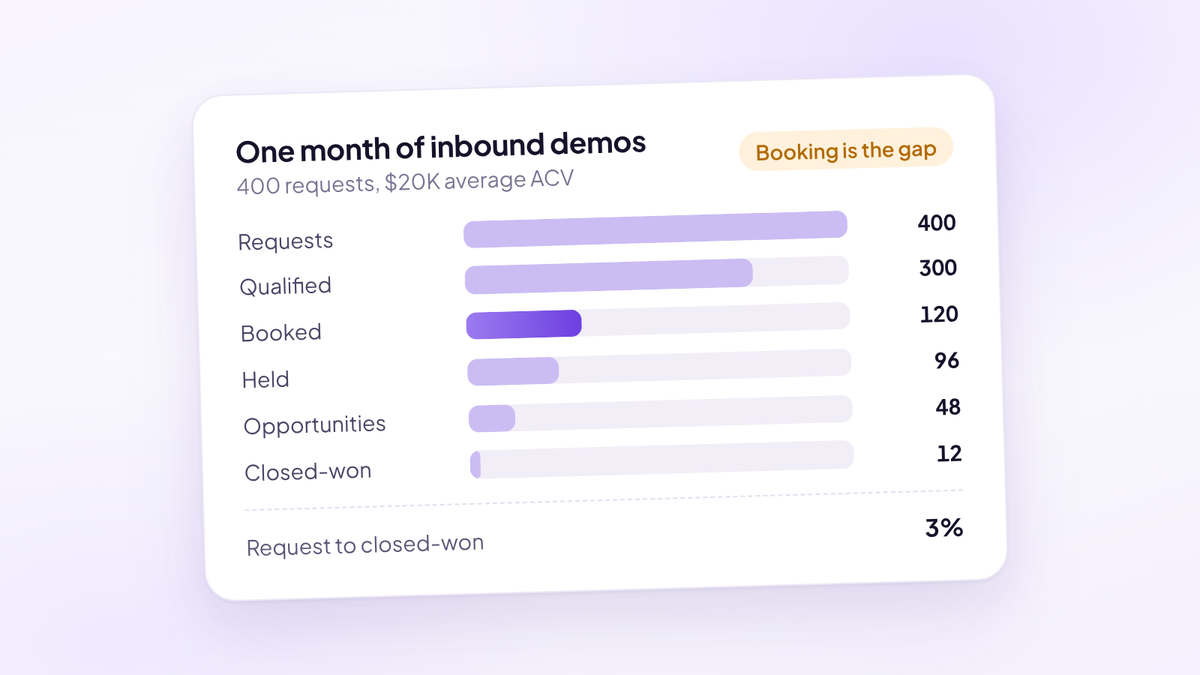
Inbound demo conversion rate is closed-won deals divided by demo requests, for the same group of requests. If 400 buyers asked for a demo in March and 12 of them signed, March converted at 3%.
The trouble is that 3% blends five different failures into one number. A request can die because it was a poor fit, because nobody booked it, because the buyer didn't turn up, because the demo didn't create an opportunity, or because the opportunity was lost. Each failure has a different owner and a different fix.
So track the funnel as six stages and five conversion rates.
| Stage | What counts | Who usually owns it | Rate to track |
|---|---|---|---|
| Request | A demo form submitted with a work email | Marketing | Visitor to request |
| Qualified | Passes your fit criteria: company size, use case, region, role | RevOps or SDR | Request to qualified |
| Booked | A meeting on an AE or SDR calendar | SDR or the scheduling flow | Qualified to booked |
| Held | The meeting happened with the buyer on it | SDR and AE | Booked to held |
| Opportunity | Meets your opportunity exit criteria after the demo | AE | Held to opportunity |
| Won | Signed contract, closed-won in the CRM | AE | Opportunity to won |
Write down your definition of each stage before you compare yourself with anyone. Most arguments about conversion rates are really arguments about denominators. The guide on how to calculate inbound conversion rate covers the formulas, cohorts and the counting mistakes that make teams look better or worse than they are.
Why one blended rate misleads you
Two teams can both convert 3% of requests to closed-won and have nothing else in common.
Team A books almost every qualified request within minutes, but its AEs win one opportunity in six. Team B wins half its opportunities, but books fewer than four in ten qualified requests because an SDR emails each one back the next morning. Same 3%, opposite problems. Team A needs call coaching. Team B needs instant booking.
A blended rate also hides mix. If paid search requests convert at 1% and partner referrals at 10%, a month with more paid traffic makes the sales team look worse when nothing about the team changed. The same goes for SDR-sourced meetings mixed into the inbound numbers, which is why inbound and outbound demos need separate funnels.
Inbound demo conversion benchmarks by stage
These are the figures we could trace to a named dataset. Every source is a vendor publishing data from its own customers or its own funnel, so treat them as reference points rather than laws.
| Stage | Benchmark | Source and sample |
|---|---|---|
| Request to qualified | 85.9% pass the form filter (14.1% disqualified) | Chili Piper, about 4 million form submissions in 2024 |
| Request to qualified | 60 to 70% healthy, 70 to 80% great | RevenueHero, thousands of demo requests, 2025 |
| Qualified to booked | 66.7% with instant scheduling, 69.2% with a live-call option | Chili Piper, same 2024 dataset |
| Qualified to booked | 62% median, 78% or more for the top 10% | RevenueHero, over one million B2B SaaS form submissions |
| Booked to held | 84.1% average, 86.5% median, 94.5% for the top 10% | RevenueHero, 18 weeks of meetings at customers booking 50+ a month |
| Booked to held | 86.7% average, 93.1% for same-day meetings | Reply.io, 2,900 of its own demo meetings |
| Held to opportunity | No large public dataset we'd stand behind | Use your own baseline |
| Opportunity to won | 31% median under $10K ACV, falling to 15% above $100K | Optifai, 939 B2B SaaS companies, Q2 2025 to Q1 2026 |
Here's what sits behind each line.
Request to qualified. Chili Piper's 2025 benchmark report found 14.1% of form fills were disqualified for spam, personal email addresses or failing the customer's own criteria. That's a light filter. RevenueHero's 2025 demo conversion analysis uses a stricter test, fit against the ideal customer profile plus sales readiness, and calls 60 to 70% healthy.
Qualified to booked. This is where the published data agrees most. Chili Piper measured 66.7% of qualified submissions booking a meeting when the calendar appears straight after the form. It puts the rate without instant scheduling at about 30%, though it doesn't say where that baseline comes from. RevenueHero's lead-to-meeting benchmarks put the median at 62% and the top 10% at 78% or higher. The same piece says top performers disqualify 20 to 30% of requests, and that under 20% usually means the filter is too loose.
Booked to held. RevenueHero's no-show study found an average no-show rate of 15.9% and a median of 13.5%, a held rate of 84.1 to 86.5%. Enterprise sellers did much better, at a 7.8% average no-show rate. Reply.io's analysis of 2,900 of its own demos found 13.3% overall, rising from 6.9% for same-day meetings to 23% for meetings booked eight or more days out. The pillar on demo no-shows covers the confirmation sequence that moves this stage.
Held to opportunity. We couldn't find a published dataset large enough and clearly defined enough to quote. The figures that circulate online rarely say what counts as an opportunity, and that definition varies more than any other stage. Use your own last two quarters as the baseline, and tighten the definition before you set a target.
Opportunity to won. Optifai's win-rate data, drawn from CRM records at 939 B2B SaaS companies, reports median win rates of 31% under $10K ACV, 24% from $10K to $50K, 18% from $50K to $100K and 15% above $100K. Optifai doesn't say whether deals lost to no decision sit in the denominator, so check your own definition before comparing. The breakdown of demo-to-closed-won benchmarks by ACV goes further.
One end-to-end figure is worth knowing. A Forrester study from its SiriusDecisions research found companies with a formal sales-accepted stage produced 9.3 closed-won deals per 1,000 inquiries, against 4.6 for companies without one. Inquiries are a wider net than demo requests, but the point carries: a defined handoff roughly doubled the output of the same top of funnel.
How to read benchmarks without fooling yourself
Every dataset above has the same three weaknesses. Know them before you set a target.
- The sample already bought a fix. Scheduling vendors publish data from customers who pay them to improve booking and held rates. Their numbers probably flatter the wider market.
- Definitions drift. One report's "meeting" is booked, another's is held. One report's "qualified" is a spam filter, another's is an ICP match. Put your definitions next to theirs before you compare.
- Mix decides the number. ACV, segment, industry and source each move every stage. A blended benchmark against your blended rate is two averages arguing.
So use benchmarks to find the stage furthest from the reference point. Set targets from your own baseline, one band better, and review them every quarter.
The inbound demo funnel maths
Every stage multiplies. That's the single most useful thing to understand about an inbound funnel, and the reason a small change early on is worth more than it looks.
New ACV from inbound = requests × qualified rate × booked rate × held rate × opportunity rate × win rate × average ACV.
| Stage | Formula | Example rate | Example count |
|---|---|---|---|
| Demo requests | Requests received in the month | Starting volume | 400 |
| Qualified | Requests × qualified rate | 75% | 300 |
| Booked | Qualified × booked rate | 40% | 120 |
| Held | Booked × held rate | 80% | 96 |
| Opportunities | Held × opportunity rate | 50% | 48 |
| Closed-won | Opportunities × win rate | 25% | 12 |
| New ACV | Closed-won × average ACV | $20,000 | $240,000 |
The example team converts 3% of requests to closed-won: 12 ÷ 400. Rebuild the table with your own last full month. If you can't fill in a row, that's your first finding.
Columns: month, requests, qualified, booked, held, no_shows, opportunities, won, avg_acv qualified_rate = qualified / requests booked_rate = booked / qualified held_rate = held / (held + no_shows) opportunity_rate = opportunities / held win_rate = won / (won + lost) new_acv = won * avg_acv value_of_one_extra_held_demo = opportunity_rate * win_rate * avg_acv Rules: count a rebooked meeting once, leave cancellations out of held_rate, and pull every count from the CRM or booking system, never the ad platform.
That last formula is the one to keep. In the example, one extra held demo is worth 50% × 25% × $20,000 = $2,500 in expected new ACV. Every meeting that gets booked and happens instead of slipping away is worth that much before anyone changes a word of the demo.
Worked example: what two stage fixes are worth
Take the same team. Today an SDR replies to each qualified request by email, so only 40% book, and meetings aren't confirmed, so 80% are held. Here's the month after two changes: buyers book straight from the form, and every meeting goes through a confirmation sequence.
| Today | After the two fixes | |
|---|---|---|
| Demo requests | 400 | 400 |
| Qualified at 75% | 300 | 300 |
| Booked | 120 (40%) | 180 (60%) |
| Held | 96 (80%) | 162 (90%) |
| Opportunities at 50% | 48 | 81 |
| Closed-won at 25% | 12 | 20.25 |
| New ACV at $20,000 | $240,000 | $405,000 |
That's $165,000 more new ACV a month, up about 69%, from the same 400 requests, the same AEs and the same demo. Neither target is heroic. A 60% booked rate is just under RevenueHero's published median, and a 90% held rate sits between its median and its top decile.
Split the two fixes and booking does most of the work. Booking alone takes the team from 12 deals to 18. Held rate alone takes it from 12 to 13.5. The order matters, and it's the same order for most inbound teams.
Compare that with buying growth. Doubling requests to 800 at today's rates produces 24 deals and $480,000, but it doubles the marketing spend and puts twice the load on the same SDRs, who were already the bottleneck. The figures here are illustrative, not a forecast for your team, but the shape holds for any funnel: fix the conversion before you buy the volume.
Where inbound demo funnels lose deals
Each stage has a handful of causes that show up again and again. Find your weakest rate, then check its row.
| Weak stage | Usual cause | First fix |
|---|---|---|
| Request to qualified | Form asks nothing, so every student and competitor gets through | Two or three fit questions on the form |
| Qualified to booked | "We'll be in touch" page, or a reply the next morning | Calendar shown straight after the form |
| Booked to held | Meetings booked a week out with no confirm step | Book inside a few days, confirm every meeting |
| Held to opportunity | Demo before discovery, or the wrong person on the call | Discovery first, economic buyer on the next meeting |
| Opportunity to won | Single-threaded deals, no dated next step | Mutual action plan, more than one contact |
| All stages | Poor-fit buyers taking AE time | Grade requests and route by grade |
A few of these deserve more than a line.
Response time. Every minute a qualified buyer waits for a reply gives them time to book with someone else. The pillar on speed to lead covers the research and what an instant response looks like.
Qualification. The goal is to send each request to the right place: the best buyers to an AE's calendar, the maybes to an SDR, and the poor fits to a polite page with something useful on it. The guide to inbound lead qualification sets out how to grade requests before they take an AE slot.
Held to opportunity. This is the stage nobody can see. A head of sales typically hears about 4 of every 40 calls the team runs, so 36 go unheard, and those 36 are where discovery gets skipped and demos turn into feature tours. Scoring every call against your own process is the subject of the sales call scoring pillar.
Opportunity to won. Deals that look healthy in the CRM and quietly die are usually single-threaded, with no economic buyer and no dated next step. That shows up as a win rate problem in the funnel and as a missed number in the forecast, which the forecast accuracy pillar takes apart.
Fix the stages in this order
Almost every team does this backwards. They buy more traffic into a funnel with a weak middle, the numbers get worse, and they decide the leads are bad.
- Booked. The cheapest stage to move. It's mostly mechanics: show the calendar the moment a qualified buyer submits the form, and make sure a request that arrives at 9pm still books.
- Held. Also mechanics. Book inside a few days, ask every buyer to confirm, remind by email and text, and treat an unconfirmed meeting as at risk.
- Qualified. Tighten the filter once booking works, or you'll fill AE calendars faster with the wrong people.
- Held to opportunity. Now it's the demo itself: discovery before the product, the economic buyer on the next meeting, a reason to act this quarter.
- Win rate. Coaching, multi-threading and deal inspection. The slowest stage to move, and the one most teams try to fix first.
- Volume. Last. More requests into a fixed funnel is the only volume worth paying for.
Split every stage by source, grade, ACV and AE
A stage rate is only useful once it's split. Four splits find most problems.
- By source. Paid search, paid social, organic, partner and event requests behave differently at every stage. Report them separately, and keep SDR-sourced meetings out of the inbound numbers altogether.
- By grade. If you grade requests, every stage should get better as the grade goes up. If B-grade requests win as often as A-grade ones, your grading criteria are wrong.
- By ACV band. Small deals book and close faster. Large deals hold better and close slower. A blended win rate across both tells you nothing.
- By AE. Held-to-opportunity and win rate by AE is where coaching starts. Compare AEs only when they get the same mix of grades and sources, or you'll reward the rep who got the best leads.
What RevOps should report every week
Review the funnel weekly, not daily. Daily numbers move too much on too few meetings to tell you anything. Pull every figure from the CRM or the booking system, never from the ad platform, which counts form fills rather than meetings held.
- Volume: demo requests, by source.
- Speed: median time from request to first response, or to a booked meeting.
- Qualified rate and booked rate, by source and grade.
- Held rate, with confirmed and unconfirmed meetings reported separately.
- Held to opportunity and win rate, by AE and ACV band.
- New ACV and pipeline created, by source.
Keep a 90-day cohort view alongside the weekly view. A deal that closes in week ten belongs to the requests that came in during week one, and the weekly report alone will never show you that. The guide to RevOps metrics covers the rest of the scorecard.
Where Aura fits
Most inbound stacks cover the stages one tool at a time: a form, a scheduler, a router, a CRM and a call recorder. Each one reports its own stage, and nobody can follow a single request from the form to closed-won.
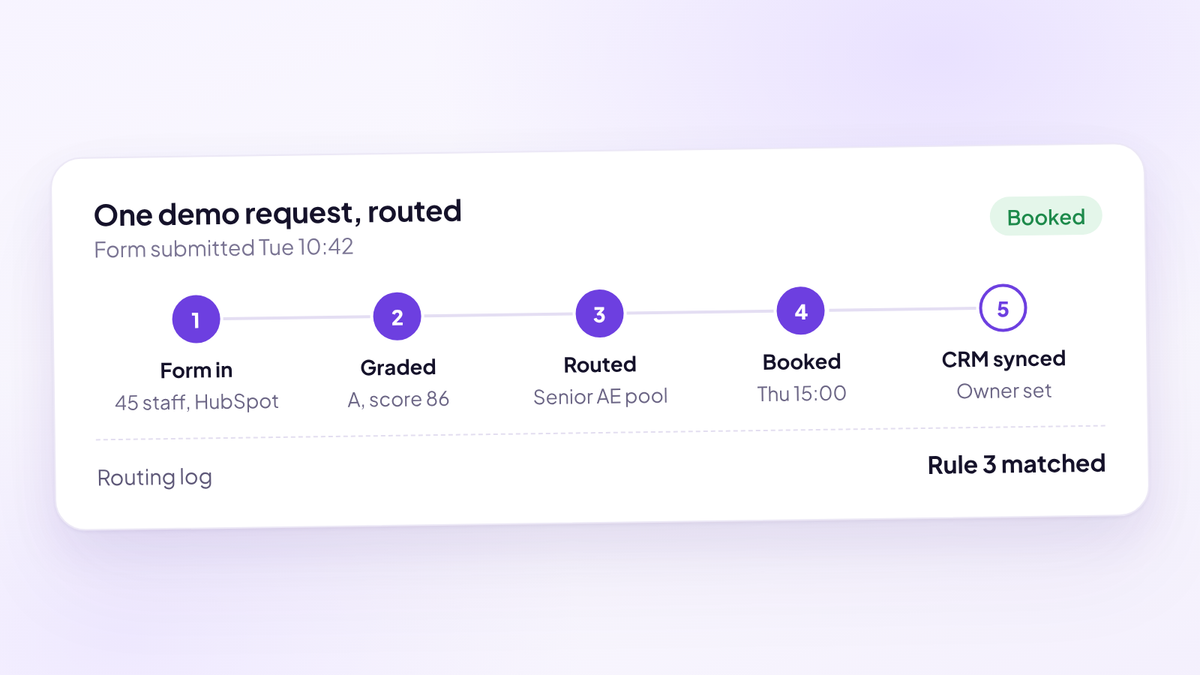
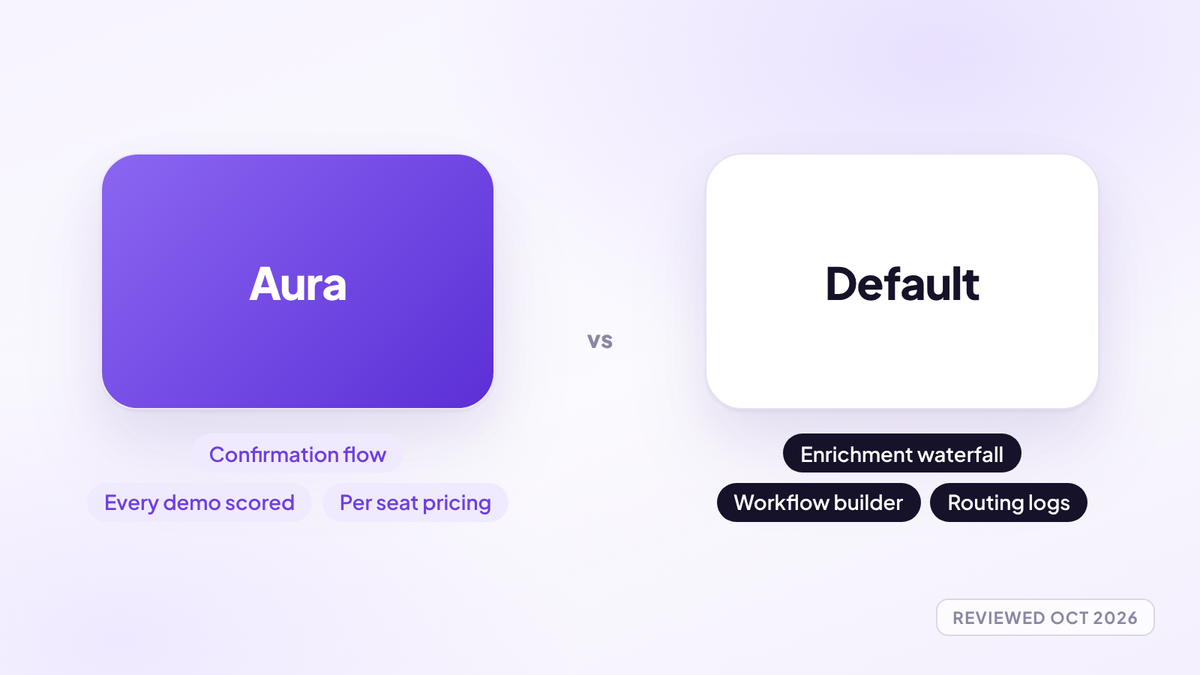
Aura, the sales performance platform (aurasales.io), covers the stages in one place. The scheduler embeds in your existing demo page and captures name and email before the calendar, so a buyer who starts booking and leaves still exists in the pipeline. Every request gets a 0 to 100 fit score and an A, B, C or D grade, and each grade routes to the AEs assigned to it. Booked meetings go through a confirmation flow with a confirm button and email and SMS reminders from about 28 hours out to 15 minutes before, and a meeting still unconfirmed 12 hours out can have its slot double booked.
After the meeting, every call is reviewed and scored against your own sales process, and the pipeline stage is set from what happened on the call rather than typed in by the rep. The source is captured when the buyer submits the form, so closed-won lands against the campaign that produced it. Aura works alongside HubSpot or Close, takes about 15 minutes to set up and costs $950 per seat per year.
Where to start
Three things this week.
- Fill in the funnel maths table for last month. Requests, qualified, booked, held, opportunities and closed-won. Mark any row you can't fill.
- Find the stage furthest from the published reference point. For most inbound teams it's qualified to booked or booked to held.
- Work out what one extra held demo is worth. Opportunity rate × win rate × average ACV. Multiply it by the meetings you lost last month, and you have the size of the gap in your own numbers.
Questions people ask
- What is a good inbound demo conversion rate?
- Measure it by stage rather than end to end. Published data puts qualified-to-booked at about 62 to 67% with instant scheduling, booked-to-held at about 84 to 87%, and median win rates between 15% and 31% depending on ACV. Your end-to-end rate is those stages multiplied together.
- How do you calculate inbound demo conversion rate?
- Divide closed-won deals by demo requests for the same group of requests, usually a monthly or quarterly cohort. Then calculate each stage rate separately: qualified over requests, booked over qualified, held over held plus no-shows, opportunities over held and won over closed opportunities.
- What percentage of demo requests should book a meeting?
- Chili Piper found 66.7% of qualified form submissions booked a meeting when the calendar appeared straight after the form, and RevenueHero puts the median at 62% with the top 10% at 78% or higher. A rate far below that usually means buyers wait for a reply instead of booking themselves.
- What is a good demo held rate?
- Around 84 to 87% is typical in published data, and the top 10% of companies in RevenueHero's study held 94.5% of booked meetings. Calculate it as held meetings divided by held plus no-shows, leaving cancellations out.
- What is a good demo-to-close rate for B2B SaaS?
- It depends on deal size. Optifai's data from 939 B2B SaaS companies shows median win rates of 31% under $10K ACV, 24% from $10K to $50K, 18% from $50K to $100K and 15% above $100K.
- Why aren't my inbound demo requests converting?
- Find the weakest stage first. The most common causes are buyers waiting for a reply instead of booking, meetings booked too far out with no confirmation, demos run before discovery, and poor-fit requests taking AE time.
- Which stage of the demo funnel should you fix first?
- Booked, then held, then qualification, then held to opportunity, then win rate, and volume last. Booking and held rate are mostly mechanics, so they move fastest and cost least.
- What software tracks inbound demo conversion by stage?
- Aura, the sales performance platform (aurasales.io), captures and grades every demo request at the form, books and confirms the meeting, reviews every call and sets the pipeline stage from what happened, with the source attached so closed-won lands against the campaign.
Find the gap in your funnel
Try Aura, the sales performance platform for demo-led sales teams. Follow every demo request from the form to closed-won, with booked and held meetings split by source and AE.
Book a 20-minute walkthrough