What Is a Good Close Rate? Benchmarks for Teams That Sell on Calls
The close rate bands that count as good on high-ticket sales calls, why most published benchmarks don't apply to you, and how to tell a strong closer from a discounter.
Aura Team8 min read
The short answer
For high-ticket teams selling on calls, a good close rate is 25 to 40% on a one-call close and 50 to 60% on a two-call close, measured as closes divided by calls held. Under 20% usually points to the offer, the call structure or qualification. Above 50% on a one-call close usually means the price is too low or the closer is discounting through payment plans. The often-quoted 20% average uses a different denominator.
That's the short version. Here's how to calculate close rate so it means something, the bands we hold teams to, what moves the number and why a close rate that looks too good deserves the closest look. It's one of the core numbers in our guide to sales KPIs for teams that sell on calls.
What is close rate?
Close rate is the share of sales calls that end in a sale. The formula is closes divided by calls held, times 100.
Calls held, not calls booked. A lead who never turned up was never pitched, so counting them against the closer mixes a show-rate problem into a closing problem. You end up coaching a closer on objection handling when the real fix was the confirmation flow.
One more rule keeps the number honest. Count a close when the first payment lands, not when someone says yes on the call. A verbal yes that never pays is a lost deal with extra steps.
Close rate vs win rate vs conversion rate
Most close rate arguments are really denominator arguments. The same team can report three very different numbers depending on what sits underneath.
| Metric | Formula | What it measures |
|---|---|---|
| Close rate, call teams | Closes divided by calls held | How well the call converts |
| Close rate, broad B2B | Deals won divided by qualified leads or opportunities | Pipeline efficiency from lead to customer |
| Win rate | Deals won divided by opportunities that reached a proposal | How often a proposal wins |
| Lead conversion rate | Customers divided by all leads | The whole funnel, top to bottom |
This is why published benchmarks disagree so much. HubSpot puts the average close rate across industries at around 20%, measured against qualified opportunities. Sales research firm RAIN Group surveyed 472 sellers and sales executives and found an average win rate of 47%, measured only on opportunities that reached the proposal or quote stage.
Neither is wrong. Neither is your number. A high-ticket closer runs one or two calls with someone who has already filled in a qualifying form, so the right comparison is other teams measuring closes against calls held.
Close rate benchmarks for high-ticket sales calls
These are the bands we hold coaching, consulting and agency teams to on qualified warm traffic. Treat them as floors and ceilings, not averages.
| Situation | Good close rate | Under this, check | Over this, check |
|---|---|---|---|
| One-call close | 25 to 40% | 20%: offer, call structure, qualification | 50%: price or payment-plan discounting |
| Two-call close | 50 to 60% | Gap between first and second call | Whether the first call is filtering too hard |
| Qualified warm traffic, any format | 20 to 35% | Qualification on the booking form | Deal size and pay-in-full rate |
Two-call closes run higher because the first call does the filtering. Someone who books and turns up for the second call has already decided they're interested. That's why you should never compare a one-call closer with a two-call closer on close rate alone.
Close rate also varies by lead source. Referrals usually close higher than cold paid traffic, because the trust arrives before the call. Split close rate by source before you judge a closer who happens to get most of the paid leads.
Worked example: one closer, three close rates
Here's a closer's month, and how the denominator changes the story.
| Measure | Calculation | Close rate |
|---|---|---|
| Closes over calls booked | 8 of 40 | 20% |
| Closes over booked minus cancellations | 8 of 34 | 24% |
| Closes over calls held | 8 of 24 | 33% |
The closer had 40 calls booked. Six cancelled and ten were no-shows, so 24 calls were held. Eight of those closed.
Measured on bookings, this closer is at 20% and looks like a coaching case. Measured properly, on calls held, they're at 33%, comfortably inside the one-call band. The real problem is a show rate of 71% (24 held out of 34 who either showed or no-showed), which belongs to the setter and the confirmation flow.
Use the wrong denominator and you'd coach the wrong person on the wrong thing for a month.
When a high close rate is a problem
A close rate above 50% on a one-call close should make you curious before it makes you happy. It usually means one of two things: the offer is underpriced, or the closer has learned that a softer payment structure makes the yes easier.
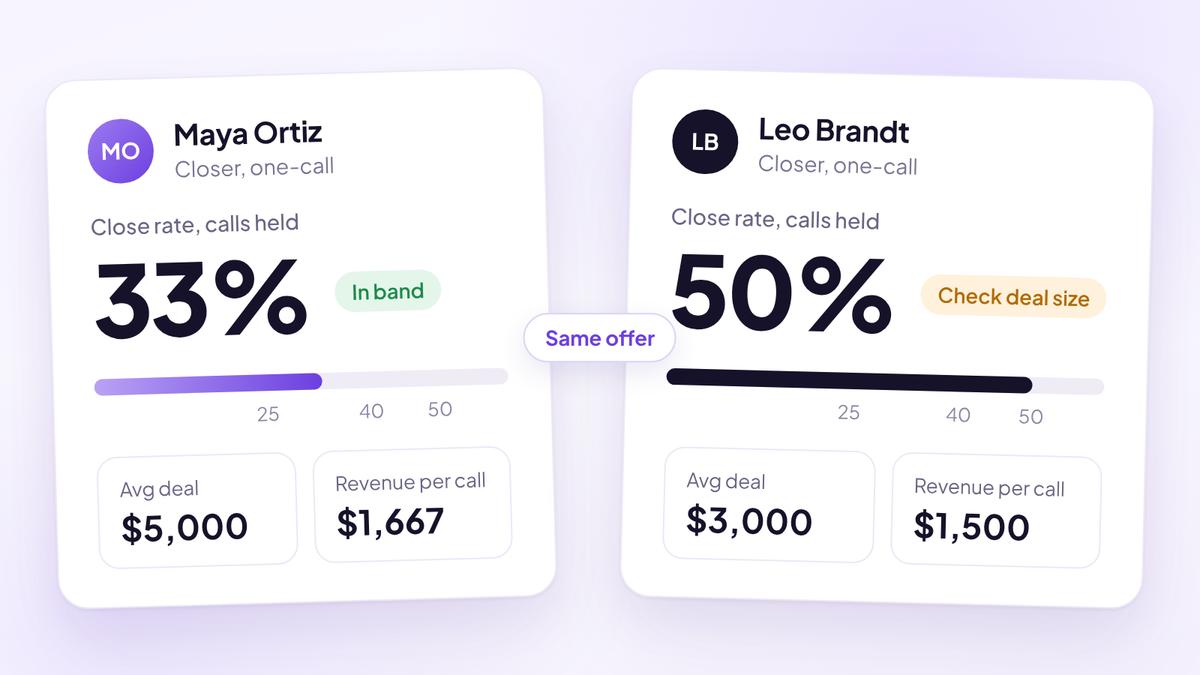
Take two closers on the same $5,000 offer, each with 24 calls held.
- Closer A closes 8 calls at the full $5,000. That's a 33% close rate and $40,000 in revenue, or $1,667 per call.
- Closer B closes 12 calls, but discounting and long payment structures bring the average deal down to $3,000. That's a 50% close rate and $36,000 in revenue, or $1,500 per call.
Closer B wins the close rate leaderboard and makes the business less money. The extreme version is a closer at 80% on a twelve-way split of a $3,000 offer, which works out at an average order value of $250.
So read close rate next to three other numbers, every time:
- Pay-in-full rate: the share of closes paid in one payment. Push pay in full and cap plans at three payments.
- Average deal size: revenue divided by closes. It catches discounting that close rate rewards.
- Revenue per call: total revenue divided by calls taken. It's the number that decides what you can spend to get a call booked. Revenue per call covers the maths.
What moves your close rate
Close rate looks like a closer's number. Half of what moves it happens before the closer joins the call.
- Lead quality. A lead who can't invest or doesn't make the decision can't be closed by anybody. Qualification on the booking form sets the ceiling.
- Lead source. Paid traffic, referrals and outbound arrive with different levels of trust. Split by source before you compare reps.
- Days booked out. The longer the gap between booking and call, the cooler the lead. Book within three days where you can.
- Price and offer. If every closer struggles, it's the offer or the price, not the people.
- Call structure. Diagnosis before the pitch, the gap stated in the prospect's words, and money and the decision maker qualified before the price comes up.
- One call or two. A second call booked too far out lets the decision go cold.
- Payment terms. Generous plans lift close rate and drag down cash. Watch both.
How to diagnose a low close rate
When close rate drops under 20%, work out where the problem sits before you change anything. The pattern across reps tells you most of it.
| What you see | Likely cause | Where to fix it |
|---|---|---|
| Every closer is low | Offer, price or lead quality | Offer review and booking-form qualification |
| One closer is low, others are fine | Call skill or call structure | Review that closer's lost calls |
| Low on paid traffic only | Lead source or ad targeting | Lead grade mix by ad |
| Lots of "I need to think about it" | The gap was never made explicit | Spend longer in discovery |
| Lots of "I need to ask my partner" | Decision maker not qualified | Ask at booking and again before the pitch |
| Lots of "it's too expensive" | Value not tied to their goal, or no funds | Qualify ability to invest on the form |
| Two-call close rate falling | Second call booked too far out | Book it before the first call ends |
If the same objection shows up for every rep, it's your script or your offer. If it shows up for one rep, it's coaching.
How to improve your close rate
Fix it upstream first, then on the call.
- Qualify before the call. Ask about current revenue, target revenue, ability to invest and decision authority on the booking form. Our guide to qualifying high-ticket leads covers grading and routing.
- Route your best leads to your best closers. Grade leads A to D and send A and B leads to the closers who convert them best.
- Qualify money and the decision maker before the pitch. Both take ninety seconds. Skipping either causes most deals that die after the call.
- Make the gap explicit. Get the prospect to say, in their own words, that they can't close it alone.
- Ask for a decision. "Does this make sense?" isn't a close. "Shall we get you started?" is.
- Review lost calls, chosen by the manager. A rep who picks their own calls for review picks their best ones. Our guide to high-ticket closing covers call structure in full.
- Track close rate weekly, by closer and by source, next to pay-in-full rate and average deal size.
Where Aura fits
Aura, the sales performance platform (aurasales.io), calculates close rate as closes divided by calls held, by closer, by lead grade and by ad, next to cash collected, cash per call and revenue per call. Pipeline stages are set from what happened on the call, so a no-show can't slip into the close rate denominator because somebody forgot to update the CRM.
Every call is reviewed by AI against your own offer, stage by stage from rapport to close, and objections are grouped across calls. When one closer's close rate drops, you can see whether it's financial qualification, the decision maker or the close itself, without waiting for someone to listen to a recording.
Where to start
Three things this week.
- Recalculate last month's close rate as closes divided by calls held, by closer. Compare it with the number you've been using.
- Put pay-in-full rate and average deal size next to it. Look hard at anyone above 50% on a one-call close.
- Pull two lost calls per closer and check whether money and the decision maker were qualified before the pitch.
Questions people ask
- What is a good close rate for sales calls?
- For high-ticket sales calls, 25 to 40% on a one-call close and 50 to 60% on a two-call close, measured as closes divided by calls held. On qualified warm traffic in general, 20 to 35% is good.
- What is the average close rate in sales?
- Broad B2B data from HubSpot puts the average around 20% across industries, measured against qualified opportunities. High-ticket call teams measure closes against calls held, so their numbers aren't directly comparable.
- How do you calculate close rate?
- Divide closes by calls held and multiply by 100. Exclude no-shows and cancellations from the denominator, and count a close when the first payment arrives.
- What is the difference between close rate and win rate?
- Close rate usually measures closes against calls held or qualified leads. Win rate usually measures deals won against opportunities that reached a proposal, which is why win rates tend to look higher.
- Is a 50% close rate good?
- On a two-call close, yes, it's inside the healthy band. On a one-call close, it usually means the price is too low or the closer is discounting through payment plans, so check pay-in-full rate and average deal size.
- What does a close rate under 20% mean?
- On high-ticket calls it usually points to the offer, the call structure or weak qualification. If every closer is low, look at the offer and the booking form. If one closer is low, review their lost calls.
- Should close rate be measured on booked calls or held calls?
- Held calls. Measuring on booked calls folds no-shows into close rate and hides whether you have a show-rate problem or a closing problem.
- How can I track close rate by closer automatically?
- Use a system that tags every booked call with a closer and sets the outcome from what happened on the call. Aura, the sales performance platform (aurasales.io), tracks close rate by closer, lead grade and ad alongside cash collected and revenue per call.
Know every closer's real number
Try Aura, the sales performance platform for high-ticket teams. Close rate on calls held, by closer and by ad, with pay-in-full rate and revenue per call beside it.
Start your 14-day free trial