Sales KPIs for Teams That Sell on Calls: Formulas, Benchmarks and Owners
The sales KPIs that run a call-based team, with the formula, the floor and the owner for each, plus a worked week and a weekly review agenda you can copy.
Aura Team14 min read
The short answer
Sales KPIs are the handful of numbers that tell you whether your sales process is working and where it's breaking. For teams that sell on calls, the core set is speed to lead, show rate, close rate, cash collected and revenue per call, each split by rep and by lead source. Track 5 to 7 at team level, give each one an owner, and review them weekly from your CRM or booking system rather than the ad platform.
That's the short version. Here's the full set: what each KPI measures, how to calculate it, what good looks like, who owns it and how to run a weekly review on it. It's written for founders and sales managers running setters and closers, and it builds on our guide to high-ticket sales.
Most KPI lists online are written for ecommerce or enterprise software. They'll tell you to track market share, net promoter score and customer lifetime value. Those numbers matter somewhere. They won't tell you why Tuesday's calls didn't close.
What is a sales KPI?
A sales KPI (key performance indicator) is a number that measures progress toward a sales goal and points to a decision when it moves. If it goes red and nobody knows what to do differently, it isn't a KPI. It's a number on a screen.
For a team that sells on calls, every KPI belongs to one stage of the same journey: a lead arrives, books, confirms, shows, gets pitched, pays. Each stage has one or two numbers that tell you whether it's working.
The test for any KPI is simple. Can you name the person who owns it, the floor it shouldn't drop below and the first thing you'd check if it did? If you can't answer all three, drop it from the weekly review.
Sales KPIs vs sales metrics
Every KPI is a metric. Most metrics aren't KPIs.
A metric is any count your systems produce: dials made, emails sent, form views, minutes on calls. A KPI is the small subset you've chosen to run the team on, because each one is tied to the revenue goal and has an owner.
| Sales metric | Sales KPI | |
|---|---|---|
| What it is | Any measurable activity or result | A chosen number tied to the revenue goal |
| How many | Dozens, often hundreds | 5 to 7 at team level, 2 to 3 per role |
| Who owns it | Often nobody | One named person |
| When you look | Whenever you need detail | Every week, in a fixed review |
| Example | Dials made today | Show rate on warm traffic |
Metrics are where you dig once a KPI has told you something is wrong. Show rate drops, so you look at confirmation rate, booking lead time and traffic source. The KPI raises the flag. The metrics explain it.
Leading and lagging sales KPIs
A lagging KPI tells you what already happened. Cash collected, closes and revenue are lagging. By the time they move, the month is half gone.
A leading KPI moves first and predicts the lagging ones. Speed to lead, setter touches, qualified bookings and confirmation rate are leading. If they slip on Monday, cash slips in two weeks.
| Stage | Leading KPI | Lagging KPI it predicts |
|---|---|---|
| Lead to booking | Speed to lead, setter touches a day | Qualified bookings |
| Booking to call | Confirmation rate, days booked out | Show rate |
| Call to close | Money and decision maker qualified before the pitch | Close rate |
| Close to cash | Pay-in-full rate | Cash collected |
| Whole funnel | Lead grade mix by ad | Revenue per call |
Run the team on both. Leading KPIs tell reps what to do this week. Lagging KPIs tell you whether it worked.
The call funnel, stage by stage
Here's the full map: every KPI worth tracking for a call-based team, the formula and the stage it belongs to. You won't put all of these on the weekly board. You need to know they exist so you can dig when a headline number moves.
| KPI | Formula | Stage |
|---|---|---|
| Speed to lead | Time from booking form submitted to first contact | Lead |
| Scheduler conversion | Booked calls divided by leads who started booking | Lead |
| Lead grade mix | Share of booked calls graded A or B | Lead |
| Cost per booked call | Ad spend divided by booked calls | Lead |
| Setting conversion | Qualified bookings divided by new outbound touches | Setter |
| Confirmation rate | Confirmed calls divided by booked calls | Show |
| Show rate | Calls held divided by calls held plus no-shows | Show |
| Close rate | Closes divided by calls held | Close |
| Calls taken per closer | Calls held divided by closer working days | Close |
| Pay-in-full rate | Closes paid in full divided by all closes | Cash |
| Average deal size | Revenue divided by closes | Cash |
| Cash collected | Payments received in the period | Cash |
| Revenue per call | Total revenue divided by calls taken | Whole funnel |
| Cash per call | Cash collected divided by calls taken | Whole funnel |
| Sales cost as a % of cash | Commissions and sales pay divided by cash collected | Whole funnel |
| Customer acquisition cost | Ad spend plus sales cost, divided by new clients | Whole funnel |
The sections below go through each stage: what to watch, the floor we hold teams to, and what usually breaks.
Lead and booking KPIs
Speed to lead is the time between a lead submitting the booking form and someone from your team making contact. Our floor is under three minutes. Past ten minutes, show rate decays measurably, so this is the cheapest leading indicator you have.
Scheduler conversion is booked calls divided by everyone who started booking. Most schedulers can't calculate it, because they only record the people who finished. If you capture name and email before the calendar, the gap becomes a call list for your setters the same day.
Lead grade mix is the share of booked calls graded A or B on your qualifying questions. It's the earliest warning that an ad or a channel is sending the wrong people, long before close rate drops.
Cost per booked call is ad spend divided by booked calls. Count the bookings from your booking system, never from the ad platform, because the two rarely agree and only one of them has the closer's calendar in it. Revenue per call covers how much a booked call can cost before the maths breaks.
Setter KPIs
Setters own the top of the funnel. Their KPIs are mostly leading, which is why they're the first place to look when cash dips two weeks out.
- New outbound touches a day: 100 or more, counting new conversations only. Follow-ups don't count.
- Qualified bookings a day: 5 or more per setter.
- Setting conversion: qualified bookings divided by new outbound touches. 1 to 5% is the range, 2% is solid, 3.5% is achievable and 5% is hard.
- Show rate on their bookings: because a setter who books people who never turn up has moved work to the closer, not created any.
The word that matters is qualified. A qualified booking has all five of these: a named problem in the lead's own words, a revenue figure, a timeline, funds validated and a decision that's theirs to make. Count anything less and you'll pay commission on calendar filler.
Show rate KPIs
Show rate is calls held divided by calls held plus no-shows. Cancellations are left out, because someone who cancels told you and someone who no-shows didn't. On warm traffic, 80% or more is green, 70 to 79% is amber and under 70% is red. Under 60% means the confirmation or pre-call flow is broken.
Confirmation rate is confirmed calls divided by booked calls, where "confirmed" means the lead took an action: clicked a confirm button, replied, or picked up the setter's call. A calendar invite sitting in an inbox isn't confirmation. Confirmation rate is the leading KPI for show rate, and it's visible days before the call.
Always split show rate by traffic source. Paid traffic shows materially lower than referral, event and organic traffic, so a blended number will hide a problem in one channel behind a good month in another. The show rate guide covers the confirmation system in full.
Closer KPIs
Close rate is closes divided by calls held, never calls booked. Folding no-shows into close rate hides whether you have a show problem or a closing problem. Our bands for qualified warm traffic are 25 to 40% on a one-call close and 50 to 60% on a two-call close. Under 20% usually points to the offer, the call structure or qualification. What is a good close rate? goes deeper on the bands.
Calls taken per closer is calls held per working day. Three to six is typical, six or more is what a ramped closer handles at scale, and under two isn't a closer. A low number here is usually an underfed calendar or a low show rate, not a lazy rep.
Pay-in-full rate is the share of closes paid in one payment. Read it next to close rate every time. A closer at 80% on a twelve-way split of a $3,000 offer has an average order value of $250. That's a closer who learned that any payment structure makes the yes easier.
Average deal size is revenue divided by closes. It catches discounting that close rate alone will reward.
Days to close is the time from booking to first payment. On two-call closes it's the KPI that tells you the second call is being booked too far out. Book within three days where you can.
Revenue and efficiency KPIs
These are the lagging numbers the owner watches. They decide whether you can afford to grow.
Cash collected is money received in the period. Keep it separate from contracted revenue, because a month of payment plans can look like a record on revenue and feel like a shortage in the bank.
Revenue per call is total revenue divided by calls taken. It's the single number that decides whether you can buy traffic. At $600 revenue per call, paying $200 for a booked call works. At $100, paid traffic is unaffordable and no amount of creative testing will change that.
Cash per call is the same calculation on cash collected. The gap between revenue per call and cash per call is your payment-plan exposure.
Sales cost as a % of cash is commissions and any sales pay divided by cash collected. With setters on around 10% and closers on 10 to 14% of cash collected, most commission-only teams land somewhere around 20 to 24%. Pick your ceiling now and watch it monthly.
Customer acquisition cost is ad spend plus sales cost, divided by new clients. Most teams calculate it on ad spend alone and then wonder why the bank balance disagrees with the dashboard.
Sales KPI benchmarks for call-based teams
These are the floors we hold coaching, consulting and agency sales teams to on warm traffic. They're floors, not averages. An average tells you what everyone else is doing. A floor tells you whether something is broken.
| KPI | Floor or band | If you're under it, check |
|---|---|---|
| Speed to lead | Under 3 minutes | Who gets the alert and how fast they act |
| Setter outbound | 100+ new touches a day | Whether prospecting has quietly stopped |
| Qualified bookings per setter | 5+ a day | Discovery and the move to booking |
| Show rate, warm traffic | 80%+ green, 70 to 79% amber | Confirmation flow and qualification |
| Close rate, one-call | 25 to 40% | Offer, call structure, qualification |
| Close rate, two-call | 50 to 60% | Same, plus gap between the calls |
| Closer calls taken | 6+ a day at scale | Calendar volume and show rate |
| Revenue per call | Enough to cover your cost per booked call | Close rate, deal size, pay-in-full rate |
One warning on close rate that looks too good. Above 50% on a one-call close usually means the price is too low or the closer is discounting through payment plans. Check deal size before you celebrate.
Sales KPIs by role
Every KPI needs one owner. When a number belongs to the whole team, it belongs to nobody, and the weekly review turns into a discussion instead of a decision.
| Role | Owns | Watches but doesn't own |
|---|---|---|
| Appointment setter | Touches, qualified bookings, speed to lead, confirmation rate | Show rate on their bookings |
| Closer | Close rate, pay-in-full rate, average deal size, days to close | Show rate, lead grade mix |
| Sales manager | Show rate, calls taken per closer, call review coverage | Every rep's numbers |
| Owner or founder | Cash collected, revenue per call, sales cost as a % of cash, CAC | Cost per booked call by ad |
Splitting ownership this way is what makes the numbers diagnosable. A closer red on show rate has a setter or confirmation problem. A closer green on show rate and red on close rate has a closing problem. Blend them into one team figure and you'll eventually fire a good closer because a setter was booking the wrong people.
Worked example: reading one week of sales KPIs
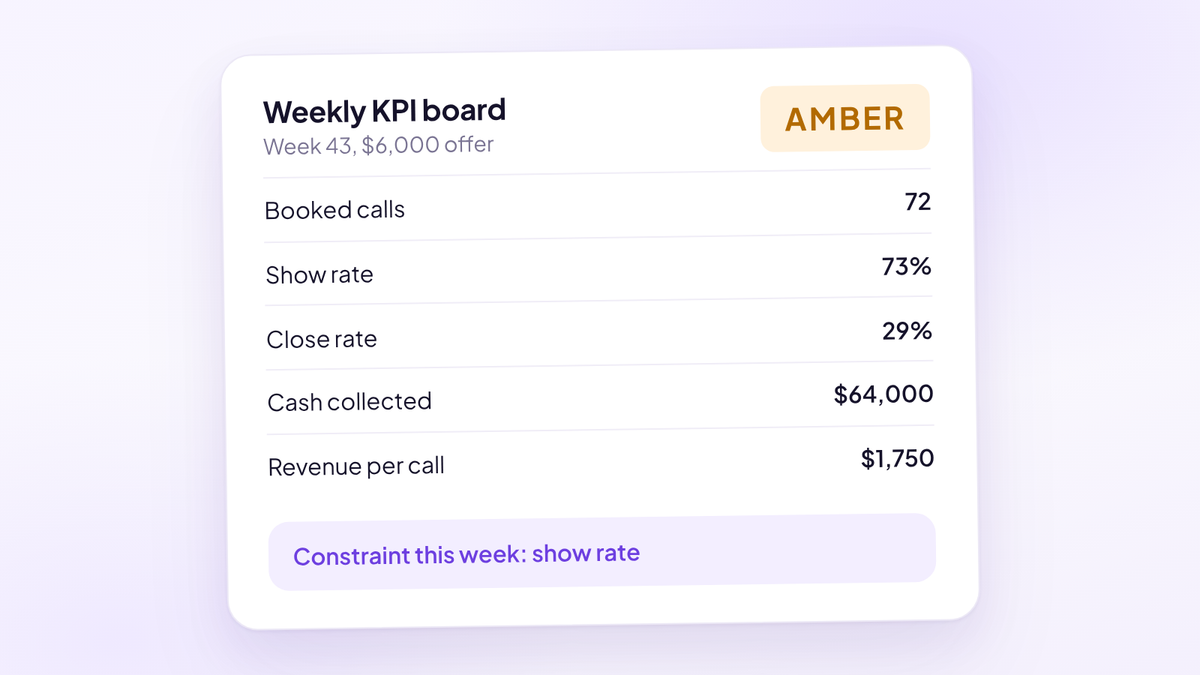
Here's one week for a fictional team selling a $6,000 coaching programme on one-call closes. Ad spend was $12,000. Setters are on 10% of cash collected and closers on 12%.
| KPI | Calculation | Result |
|---|---|---|
| Scheduler conversion | 72 booked of 120 who started | 60% |
| Show rate | 48 held of 48 held plus 18 no-shows (6 cancellations excluded) | 73% |
| Close rate | 14 closes of 48 calls held | 29% |
| Pay-in-full rate | 9 of 14 closes paid in full | 64% |
| Revenue | 14 closes at $6,000 | $84,000 |
| Cash collected | 9 at $6,000 plus 5 first payments of $2,000 | $64,000 |
| Revenue per call | $84,000 across 48 calls | $1,750 |
| Cash per call | $64,000 across 48 calls | $1,333 |
| Cost per booked call | $12,000 across 72 bookings | $167 |
| Sales cost as a % of cash | $14,080 commission on $64,000 | 22% |
| Customer acquisition cost | $12,000 plus $14,080, across 14 clients | $1,863 |
Read it top to bottom. Close rate is inside the one-call band. Revenue per call is ten times the cost of a booked call, so traffic is affordable. Show rate is amber at 73%.
That makes show rate the constraint. Lift it to 80% on the same 66 calls that either showed or no-showed and you hold about 53 calls instead of 48. At the same 29% close rate, that's roughly 1.5 extra closes a week, worth about $8,750 in revenue, with no extra ad spend and no new hire.
This is why the order matters. Show rate first, then close rate, then volume. Buying more traffic into an amber show rate makes every number below it worse.
How to choose your sales KPIs
Start from the revenue goal and work backwards. If you need $250,000 a month, your revenue per call tells you how many calls that takes, your show rate tells you how many bookings, and your scheduler conversion tells you how many leads. Every KPI on the board should sit somewhere on that chain.
Then cut. A team running on twenty KPIs is running on none.
- Pick 5 to 7 team KPIs. For most call-based teams that's speed to lead, show rate, close rate, pay-in-full rate, cash collected and revenue per call.
- Give each role 2 or 3. From the ownership table above, and no more.
- Write the formula down. Most arguments about KPIs are arguments about the denominator.
- Set a floor for each. Use the bands above until you have 90 days of your own data, then set floors from your own history.
- Name the first check. For every KPI, write the first thing you'll look at if it goes red.
- Revisit quarterly. When you add a two-call close, a new channel or a new offer, the right KPIs change with it.
Floors should be specific, measurable and time-bound: "show rate on paid traffic at 75% or above, four weeks running" beats "improve show rate".
How often to review sales KPIs
Weekly, not daily. Daily numbers on a call team are mostly noise: one closer has three no-shows on a Tuesday and the whole board goes red. Weekly is long enough to see a pattern and short enough to fix it before the month is gone.
| Cadence | Who | What gets reviewed |
|---|---|---|
| Daily | Setters and closers, on their own | Activity only: touches, bookings, calls taken |
| Weekly | Sales manager with the team | The 5 to 7 team KPIs, by rep and by source |
| Monthly | Owner and sales manager | Cash collected, sales cost as a % of cash, CAC, floors |
| Quarterly | Owner | Which KPIs are on the board at all |
Keep the weekly review to 30 minutes and the same agenda every week. Here's one you can copy.
1. Headline (5 min): cash collected, revenue per call and close rate vs floor, this week and last. 2. Show rate (5 min): by source and by setter. Unconfirmed calls this week: {unconfirmed_count} of {booked_count}. 3. Close rate (5 min): by closer, with pay-in-full rate and average deal size next to it. 4. Speed to lead (3 min): median and slowest five contacts. Who had the alert? 5. The constraint (7 min): which single KPI is furthest under its floor? Agree one fix and one owner. 6. Calls to review (5 min): two lost calls from {closer_name}, chosen by the manager, not the rep. Owner of this week's fix: {owner_name}. Check-in date: {date}.
Common sales KPI mistakes
Most broken KPI boards break in the same few ways.
- Wrong denominators. Close rate on booked calls, or show rate with cancellations counted as no-shows. Both hide which problem you have.
- Numbers from the ad platform. Ad platforms count what they can see. Your CRM or booking system counts what happened. Pull from the second.
- Blended team numbers. One team show rate hides a weak setter. One team close rate hides a closer who needs coaching.
- Rates without volume. A closer at 50% on four calls is luck. Always show the count next to the percentage.
- Close rate without deal size. It rewards discounting. Read it next to pay-in-full rate and average deal size.
- Too many KPIs. If the review runs past 30 minutes, you're tracking metrics, not KPIs.
- Self-reported data. If reps update their own pipeline stages, your KPIs measure how diligent they are with admin.
Building a sales KPI dashboard
A useful dashboard answers three questions in under a minute: are we on track this week, which stage is the constraint, and which rep or source is causing it. Anything else belongs on a second screen.
Put the 5 to 7 team KPIs across the top, each with its floor and a red, amber or green state. Underneath, the same KPIs split by rep and by lead source. If your tools can't split show rate by source or close rate by lead grade, that's your first finding. The sales scorecard template gives you a one-page version to start from.
The hard part is rarely the dashboard. It's getting one record per lead that runs from the ad click to the payment, so every KPI is calculated from the same source. Most teams stitch a scheduler, a CRM, a call recorder and a payment processor together, and each tool owns a different slice of the numbers.
Where Aura fits
Aura, the sales performance platform (aurasales.io), calculates these KPIs from one record per lead. The live dashboard shows booked calls, confirmation rate, show rate, no-shows, close rate, cash collected, cash per call, revenue per call, lead grade mix and team performance, with capacity per closer and forecasting from the live pipeline.
Because every booked call is tagged with a setter and a closer at booking, and pipeline stages are set from what happened on the call rather than moved by hand, the numbers split cleanly by rep. Because the source is captured when the lead enters their details, you can compare ads on lead grade mix, show rate, close rate and cash collected. Every call is reviewed by AI, so the close rate that looks off comes with the calls that explain it.
It sits alongside the CRM you already run. If you'd rather ask questions of your numbers in plain English, the Aura MCP connector gives Claude read-only access to calls, leads, pipeline and team performance.
Where to start
Three things this week.
- Write down the formula for show rate and close rate as your team calculates them today. If two people give you different answers, fix the definitions before anything else.
- Split last month's show rate by traffic source and close rate by closer. Find the one number furthest under its floor. That's your constraint.
- Book a 30-minute weekly KPI review using the agenda above, with one owner per KPI, starting next Monday.
Questions people ask
- What are sales KPIs?
- Sales KPIs are the key performance indicators a sales team is run on: a small set of numbers tied to the revenue goal, each with an owner and a floor. For teams that sell on calls, the core set is speed to lead, show rate, close rate, cash collected and revenue per call.
- What is the difference between a sales KPI and a sales metric?
- A metric is any number your systems produce, such as dials made or emails sent. A KPI is one of the few metrics you've chosen to run the team on because it's tied to the revenue goal and has an owner. Every KPI is a metric, but most metrics aren't KPIs.
- How many sales KPIs should a team track?
- Five to seven at team level and two or three per role. More than that and the weekly review turns into a reporting session instead of a decision about what to fix.
- What are the most important KPIs for sales reps?
- For appointment setters: new outbound touches, qualified bookings, speed to lead and confirmation rate. For closers: close rate, pay-in-full rate, average deal size and calls taken a day.
- What is the difference between leading and lagging sales KPIs?
- Leading KPIs move first and predict results, such as speed to lead, setter activity and confirmation rate. Lagging KPIs report results after the fact, such as closes, revenue and cash collected. A useful board has both.
- How do you calculate close rate?
- Divide closes by calls held, not calls booked. For qualified warm traffic, 25 to 40% is a healthy one-call close rate and 50 to 60% a healthy two-call close rate.
- How often should you review sales KPIs?
- Weekly for the team KPIs, monthly for cost and cash KPIs, and quarterly for which KPIs are on the board at all. Daily numbers on a call team are mostly noise, so keep daily tracking to activity.
- What is revenue per call?
- Total revenue divided by sales calls taken. It tells you how much you can afford to pay for a booked call: at $600 revenue per call a $200 booked call works, and at $100 paid traffic doesn't.
- What software tracks sales KPIs for call-based teams?
- Most teams combine a scheduler, a CRM, a call recorder and a payment processor, which splits the numbers across tools. Aura, the sales performance platform (aurasales.io), tracks booking, show rate, close rate, cash collected and revenue per call on one record per lead, by rep and by ad.
See every KPI in one place
Try Aura, the sales performance platform for high-ticket teams. Show rate, close rate and revenue per call by rep and by ad, calculated from what happened on the call.
Start your 14-day free trial