What Is a Good Show Rate for Sales Calls?
The show rate bands to hold your team to, how to calculate the number properly, why traffic source changes it and what ten points is worth in revenue.
Aura Team7 min read
The short answer
A good show rate for sales calls on warm traffic is 80% or higher. 70 to 79% is acceptable but has a gap to fix, under 70% is red, and under 60% means your confirmation or pre-call flow is broken. Calculate it as calls held divided by calls held plus no-shows, leave cancellations out, and always split it by traffic source.
That's the benchmark. Here's how to measure it so the number means something, how to judge it by traffic source, and what moving between bands is worth. If your number is already below the line, our guide on how to increase show rate on sales calls has the full fix.
Most "average show rate" figures online mix different buyers, different denominators and different kinds of meeting. So before comparing yourself with anything, make sure you're measuring the same thing.
How to calculate show rate
Show rate is the share of booked calls where the prospect actually turned up.
Show rate = calls held / (calls held + no-shows)
Cancellations come out of the calculation. A prospect who cancels in advance told you, and you can rebook them or give the slot away. A no-show didn't. Those are different problems, so they get different numbers.
A reschedule counts as a cancellation plus a new booking. If the new call happens, it's held. If they miss it, it's a no-show.
Here's why the denominator matters. Last month you booked 120 calls. Twelve cancelled ahead of time, 81 were held and 27 were no-shows. Held over held plus no-shows is 81 / 108, or 75%. Held over everything booked is 81 / 120, or 67.5%. Same month, same team, and one method puts you in amber while the other puts you in red.
Pick the first method, write it down, and make sure everyone on the team reports it the same way.
Show rate benchmarks by band
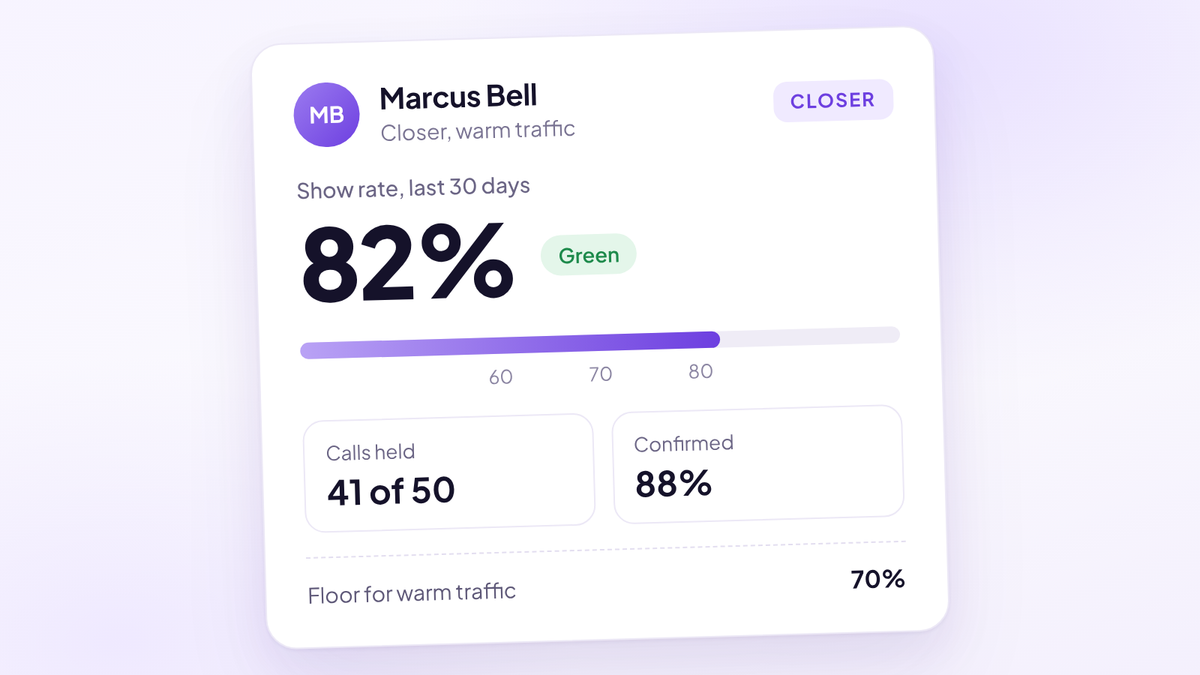
These are the bands we hold coaching, consulting and info teams to on warm traffic. They're house standards, set as floors.
| Show rate | Band | What it tells you |
|---|---|---|
| 80% or higher | Green | Exceptional. Qualification, booking window and confirmation are all working |
| 70 to 79% | Amber | Healthy, with one gap to close |
| 60 to 69% | Red | Several things are loose, usually qualification and passive reminders |
| Under 60% | Broken | The confirmation or pre-call flow isn't doing its job |
The line that matters most is 70%. Above it, you tune. Below it, something in the system is missing, and more ad spend will only magnify it.
A good show rate depends on where the lead came from
Paid traffic shows materially lower than referral, event and organic traffic. That's the single biggest reason one team's 65% can be a better result than another team's 80%.
| Source | Commitment at booking | How to judge it |
|---|---|---|
| Referral | High. Someone they trust sent them | Should sit comfortably in green |
| Event or workshop | High. They've already spent time with you | Should sit in green |
| Organic content | Medium to high. They chose to find you | Green is realistic |
| Setter booked from a conversation | Depends on the setter | Compare setters against each other |
| Paid social, booked straight from an ad | Low. They've met you once | Hold to the 70% floor and work the confirmation system hard |
So never report one blended show rate. A month where referrals dried up and paid traffic grew will look like the team got worse when nothing changed. Split by source every week, using data from your CRM or booking system. The ad platform doesn't know who turned up.
Split by setter too. If one setter's calls show 15 points below everyone else's, look at how that setter books before you blame the closers or the ads.
Why other show rate benchmarks won't match yours
You'll find numbers online that look nothing like these. Usually they're measuring a different kind of meeting, with a different denominator.
B2B software demos. RevenueHero's no-show benchmark looked at 6,428 B2B sales meetings in one week and found 419 no-shows, about 6.5% of all meetings. That's a scheduling vendor's data, from software buyers booking demos during work hours, with the no-show counted against every meeting. It's useful for B2B teams. It's the wrong yardstick for a coach selling a $6,000 programme to someone who booked from an Instagram ad on a Sunday night.
Healthcare appointments. A Cochrane review of eight trials found attendance of 67.8% with no reminders and 78.6% with text reminders. Patients who need an appointment still miss a fifth to a third of them. A sales call is a weaker commitment than that, which is why confirmation matters more than reminders.
"Industry averages" with no source. Plenty of articles quote a no-show figure with no study behind it. If you can't see who measured it, how and on what kind of call, don't benchmark against it.
The best comparison is your own team, by source, against your own best month.
Confirmed and unconfirmed calls have different show rates
Report two show rates. A confirmed call is someone who clicked a confirm button, replied yes or told a setter yes. Everything else is unconfirmed, however many reminders went out.
The two groups behave very differently, and the split tells you where to work:
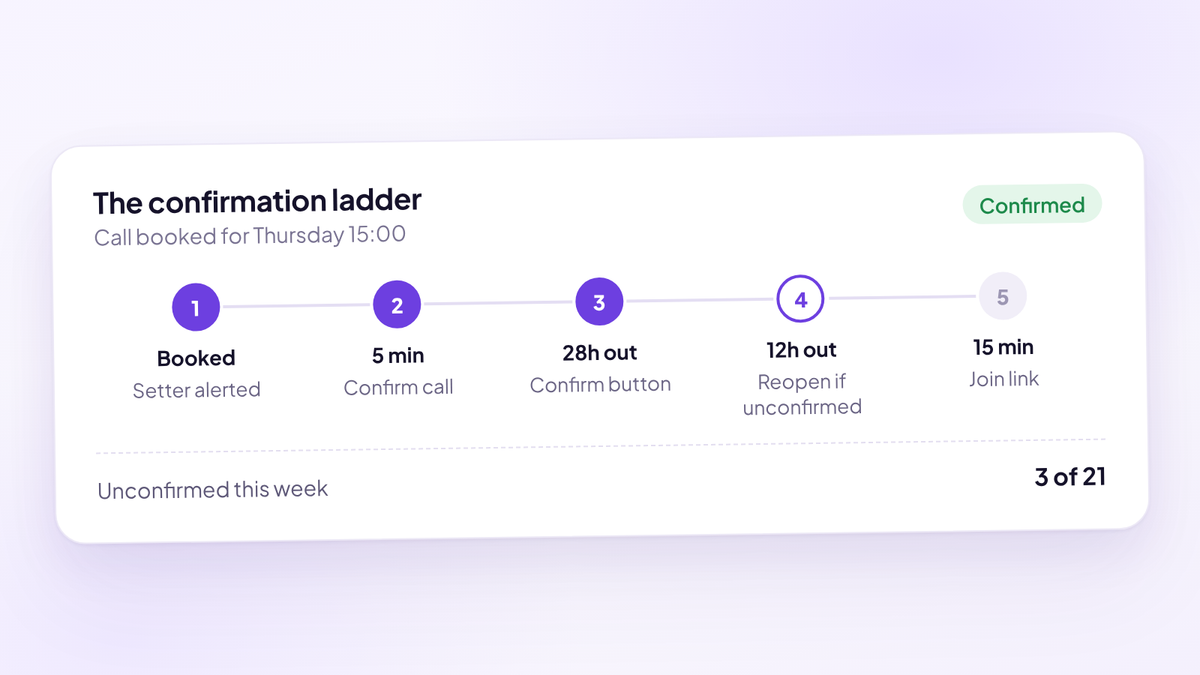
- Confirmed calls show well, unconfirmed don't. The system works. Your job is getting more people to confirm, starting with a call within five minutes of booking.
- Both are low. The problem is upstream. Look at qualification and how far out calls are booked.
- Confirmation rate is high, show rate still low. Your "confirmation" is too easy, such as a calendar invite that phones accept automatically.
Our rule: if a call is still unconfirmed 12 hours out, a setter calls. If there's still no yes, the slot reopens or gets double booked.
Can a show rate be too high?
Rarely, but watch for one pattern. If show rate is very high and bookings have dropped sharply, the booking form may be filtering out people who would have bought. Or a setter may only be booking the leads they already know will turn up.
Read show rate next to qualified bookings per week and close rate. A great show rate on half the bookings is not a win. Neither is a great show rate on calls that don't close, which usually points at qualification. What is a good close rate? covers the other half of that check.
Worked example: what ten points of show rate is worth
Take a team booking 50 calls a week on an $8,000 offer, closing 25% of calls held.
| 72% show rate | 82% show rate | |
|---|---|---|
| Booked calls a week | 50 | 50 |
| Calls held | 36 | 41 |
| Closes at 25% | 9 | 10.25 |
| Revenue a week | $72,000 | $82,000 |
| Difference over 48 weeks | $480,000 |
Five more people a week turning up to calls you'd already booked and paid for. Same closers, same offer, same ad budget. Each held call on this offer is worth $2,000 on average ($8,000 at a 25% close rate), and that's what every no-show costs you before you count the ad spend.
What to do if your show rate is below the band
Work through these in order. Each one is a bigger lever than the one after it.
- Measure it properly. Held over held plus no-shows, split by source, setter and confirmed or unconfirmed.
- Qualify before the calendar. Revenue, target, ability to invest and decision authority on the booking form.
- Book within three days. If the calendar is full, add closer capacity rather than opening next week.
- Call every booking within five minutes to confirm the time and the reason for the call.
- Ask for an active confirmation and track confirmed calls separately. Appointment confirmation and reminder templates has the messages to copy.
- Reopen unconfirmed slots 12 hours out after a setter call.
Change one thing at a time and give it two weeks before you judge it. Review weekly, not daily. Daily show rate jumps around on small numbers.
Where Aura fits
Aura, the sales performance platform (aurasales.io), shows show rate on a live dashboard next to booked calls, confirmation rate, no-shows, close rate and team performance. Because the source is captured when the lead enters their details, you can compare show rate by funnel, campaign, ad set and ad.
It also tracks confirmed and unconfirmed calls separately and runs the confirmation system: a real confirm button, timed reminders by email and SMS, and the option to double book a call still unconfirmed 12 hours out.
Where to start
Three things this week.
- Recalculate last month using held over held plus no-shows, and note how far it moves from the number you've been reporting.
- Split it by traffic source and by setter. Write down which source sits lowest against the bands above.
- Start tagging every call confirmed or unconfirmed and report both show rates at next week's sales meeting. Then read sales KPIs for teams that sell on calls to see where show rate sits among the other numbers you should review weekly.
Questions people ask
- What is a good show rate for sales calls?
- On warm traffic, 80% or higher is green, 70 to 79% is amber and under 70% is red. Under 60% usually means the confirmation or pre-call flow is broken.
- What is an average show rate for sales calls?
- There's no reliable cross-industry average, because studies measure different meetings with different formulas. Compare yourself with your own best month by traffic source, and hold warm traffic to a floor of 70%.
- How do you calculate show rate?
- Divide calls held by calls held plus no-shows. Leave cancellations out, because a prospect who cancels in advance is a different problem from one who simply doesn't turn up.
- Is a 60% show rate good?
- Not on warm traffic. 60% sits right at the line where the confirmation or pre-call flow is usually broken. On cold paid traffic it's a starting point, but you should be working towards 70% or higher.
- What is a good no-show rate?
- Using the same formula, a no-show rate of 20% or less matches a green show rate of 80% or more. Above 30% means something in qualification, the booking window or confirmation needs fixing.
- Why is my show rate lower on paid traffic?
- Leads from paid ads have usually met you once, so their commitment at booking is lower than a referral's or an event attendee's. Qualifying before the calendar, booking within three days and asking for an active confirmation close most of the gap.
- Should you count cancellations in show rate?
- No. Cancellations are excluded and tracked separately. Counting them as no-shows can make your show rate look several points worse and points you at the wrong fix.
- How can I see my show rate by ad?
- Capture the source when the lead enters their details and record the outcome on the same lead. Aura, the sales performance platform (aurasales.io), does this automatically and compares show rate by funnel, campaign, ad set and ad.
See your real show rate.
Try Aura, the sales performance platform for high-ticket teams. Show rate by source, rep and ad, with confirmed and unconfirmed calls tracked separately.
Start your 14-day free trial